Monitor AI Task
Dashboard
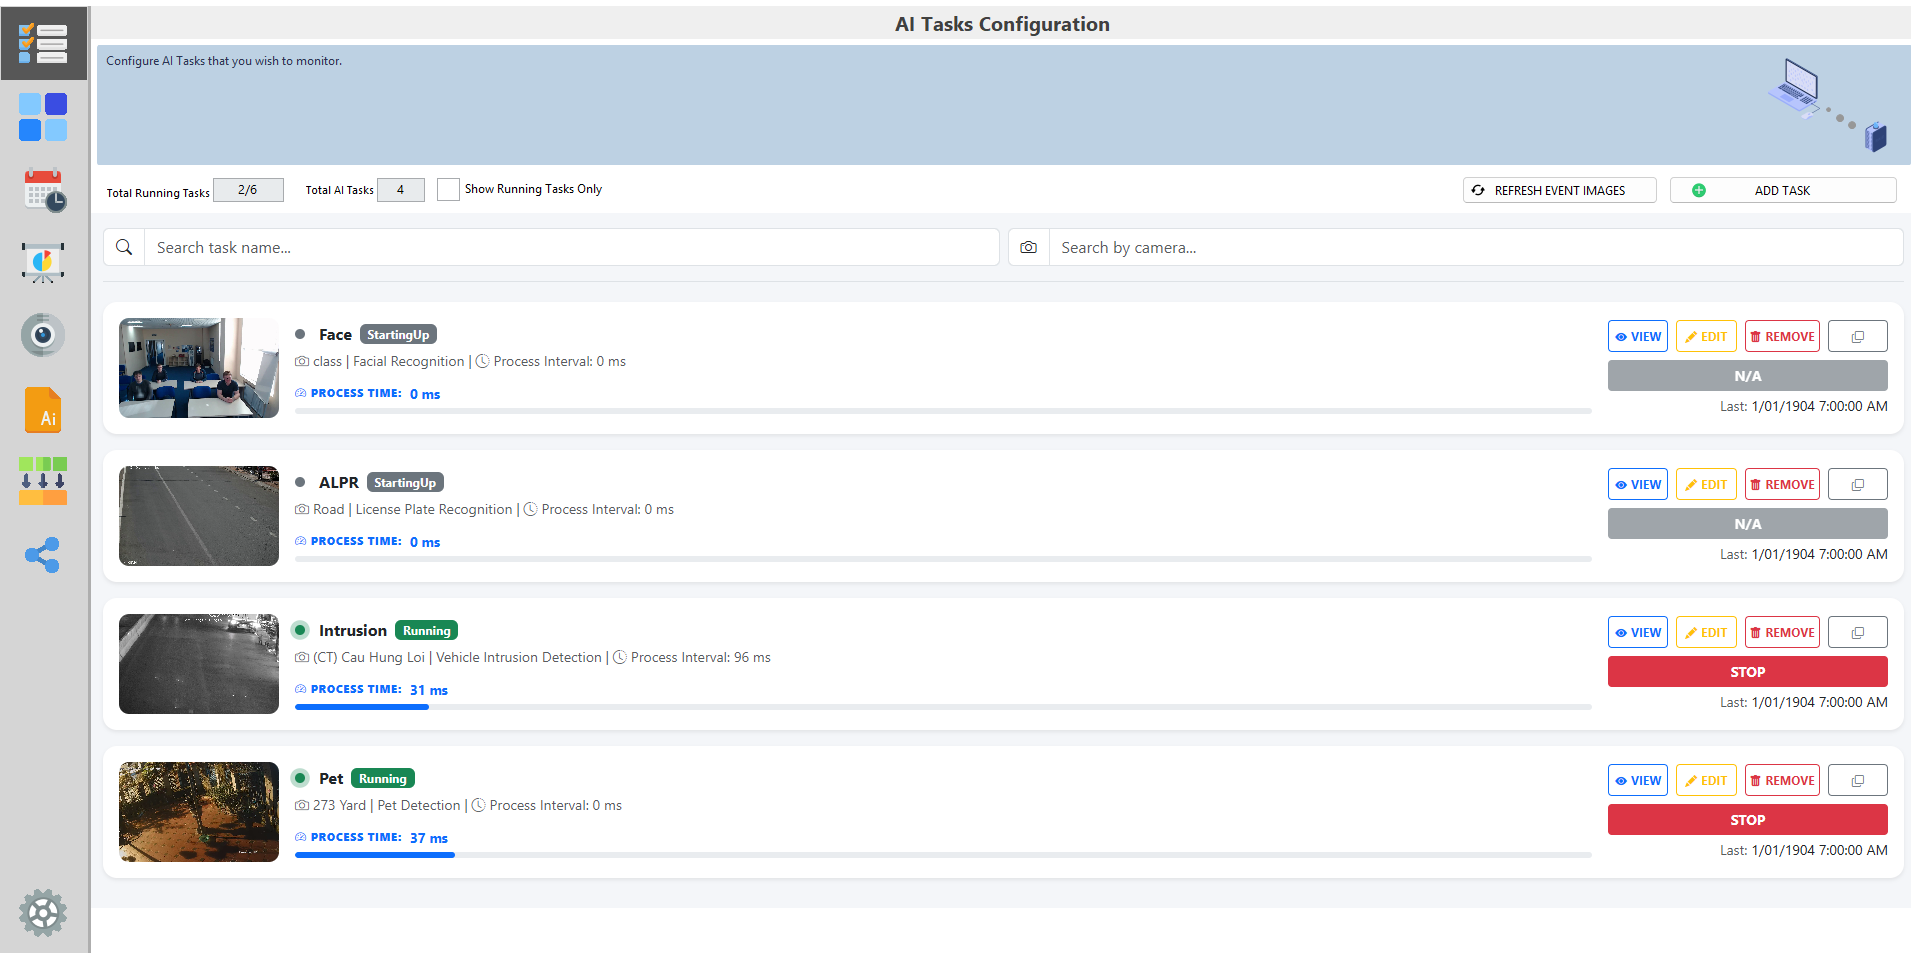
From the AI Tasks dashboard page, you can manage all your AI Tasks efficiently
Header Control
Total Running Tasks: Displays how many tasks are currently running vs the maximum running tasks for current license key. You can't run more than the maximum numberTotal AI Tasks: Total number of AI tasks createdShow Running Tasks Only: This will filter the task list and only show Running tasks- You can use the search bar to filter tasks by camera name or task name
Task Card
Each task is shown as a separate card containing key details and controls.
Snapshot Image: A preview image from the camera feed.Name: Task name, camera nameProcess Time (ms): Time taken for AI inferencing per interval, with a loading bar for performance overview, higher values may indicate processing delays.Process interval (ms): Time taken to complete an interval (including get camera image > pre-processing > AI inferencing > Trigger)VIEW: Open the event log of the AI TaskEDIT: Opens the AI Task configuration page.REMOVE: Deletes the AI task.DUPLICATE: Duplicate the AI Task settingSTART / STOP: Start and stop the AI Task
- Only start tasks you intend to monitor actively to optimize server performance.
- Regularly check the process time/process interval to identify heavy tasks that may affect performance.
Multiview
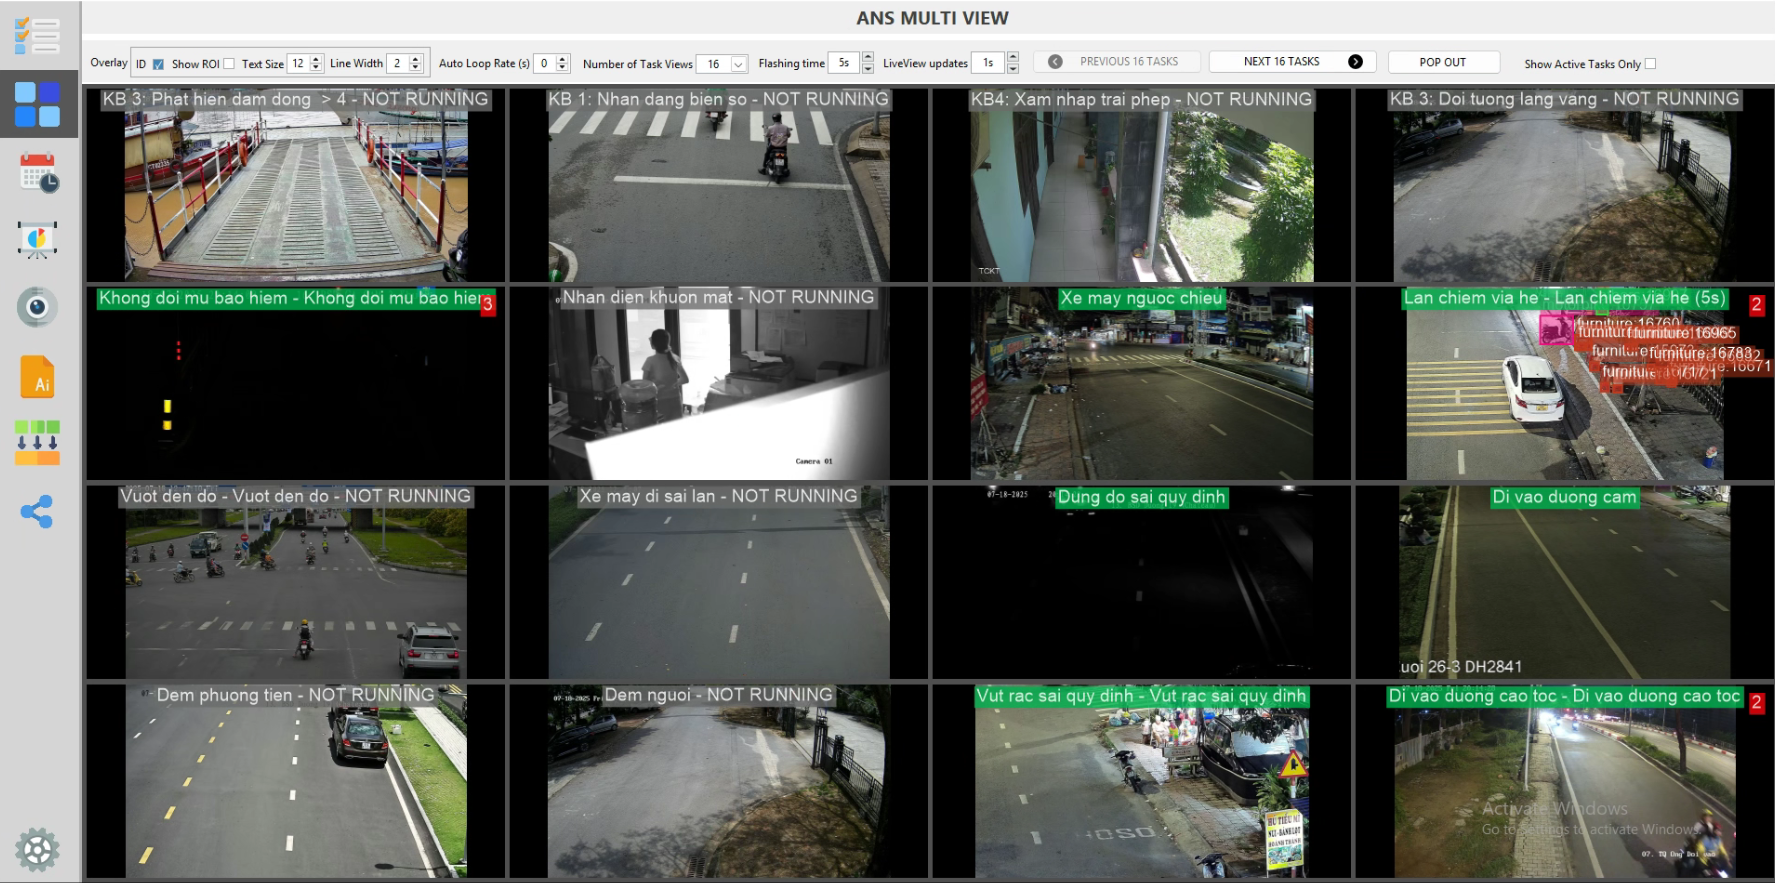
The Multiview page offers a centralized live view of all running AI Tasks, making it ideal for operators and control centers to monitor AI detections in mutiple cameras real time.
To reduce system load and ensure smooth AI event analysis, the live image refreshes at a maximum rate of 1 frame/second instead of showing continuous motion. This feature is intended for camera status and event monitoring only, and the displayed frame rate does not reflect the actual camera frame rate. Real-time motion may not appear, but event alerts are processed instantly.
View Mode
Number of Task View: Define how many task windows are displayed on the screen at once (e.g., 1, 2, 4, 6...). Customize the layout depending on the number of active tasks.Auto Loop Rate: Enables automatic rotation between different sets of tasks. Set the loop interval (in seconds) for switching views.- Manual Navigation: Use
Previous/Nextbuttons to manually switch between task groups if Auto Loop is disabled. - Use
Pop Outto view Multiview in a separated window - Use
Show Active Task Onlyto filter inactive task
Alerts Behavior
- Yellow Flashing
- When a new event is detected, the related task will flash yellow to grab the operator's attention.
- You can configure how long the flashing lasts via the
Flashing Timesetting.
- Event Counter
- A red number will appear in the top-right corner of the task view to indicate how many events have occurred since Multiview was opened.
- Click the red number to open the Event Log for that task.
- This counter will reset once clicked.
Live Camera Feed
- When there are no alerts, the task displays a live view from the camera.
- The live image refreshes at a maximum rate of 1 frame/second, and the refresh rate can be adjusted via the
LiveView updatesetting.
Event Log
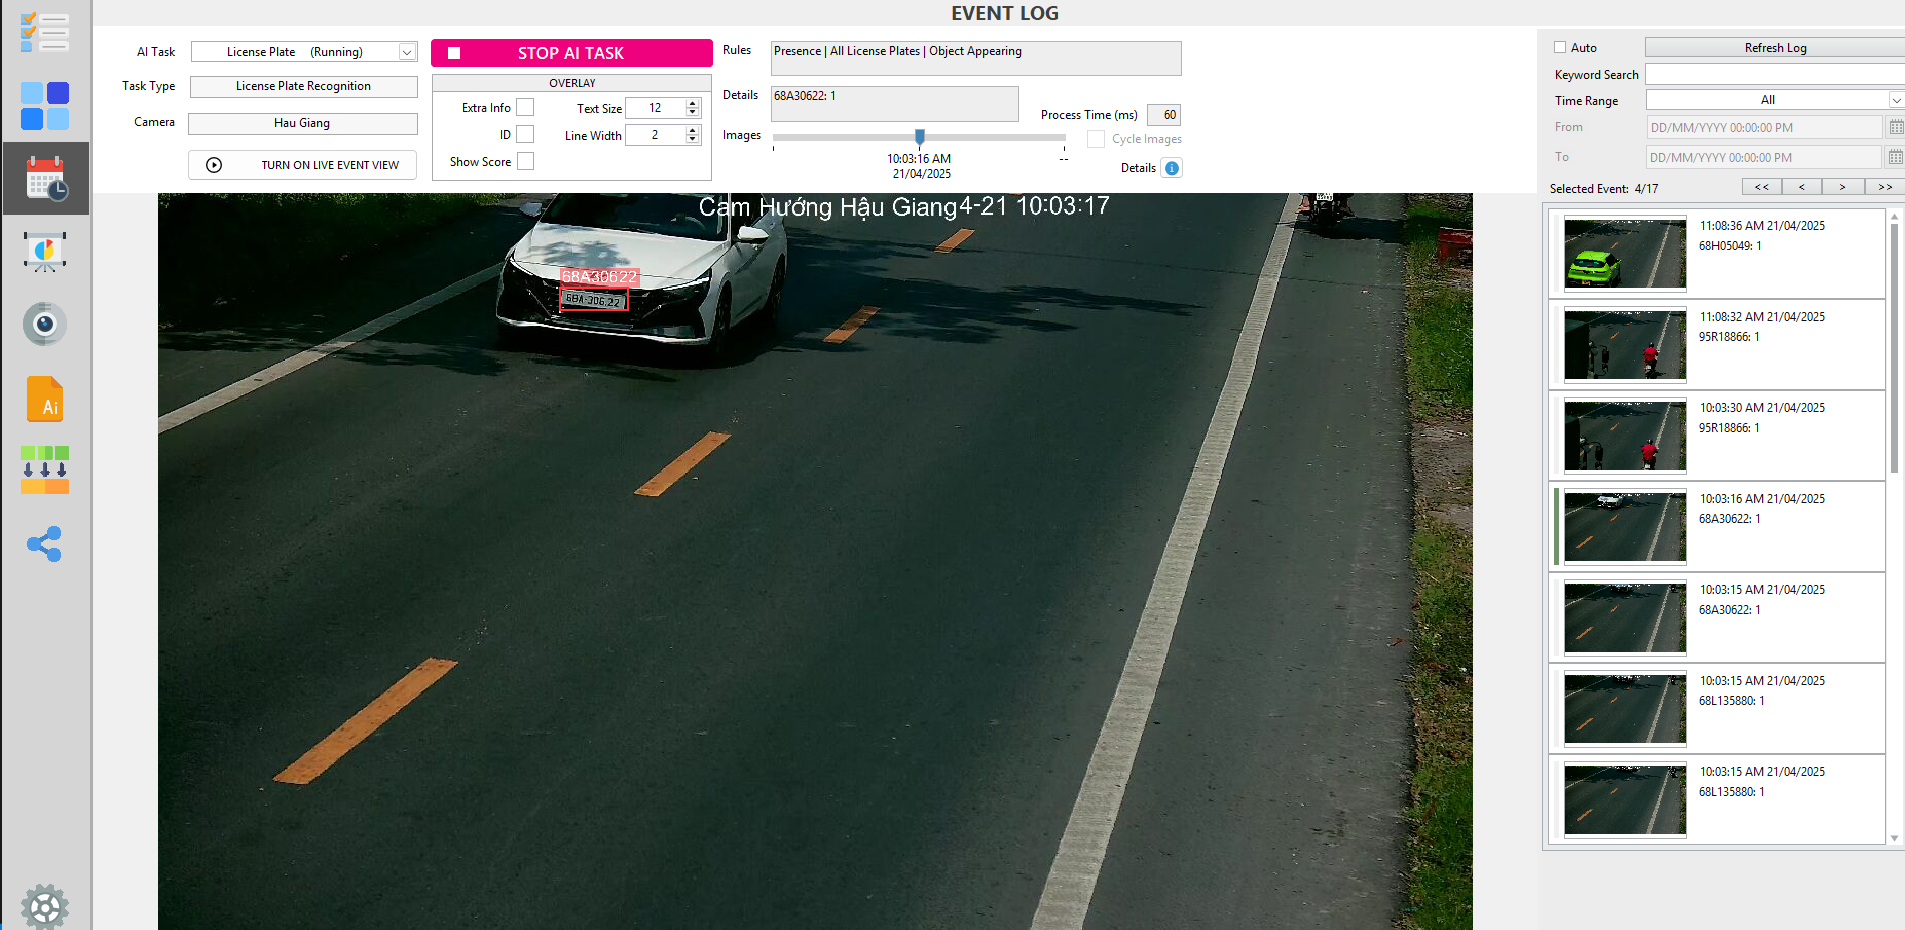
The Events Log page provides a centralized interface for reviewing all events detected by AI Tasks. It is designed for quick incident review and streamlined monitoring using event snapshots.
Real-Time Updates
- New events appear at the top of the list for immediate visibility.
- Press
Autocheckbox to automatically update new event in the list, orRefresh Logbutton to manually doing so.

- Press
Turn On Live Event Viewto automatically display large image of latest event
Event Image Info
- Each event includes snapshot image(s) showing what triggered the detection. These images, along with details like timestamps and additional metadata, give users a clear and comprehensive record for deeper insights and follow-up actions.
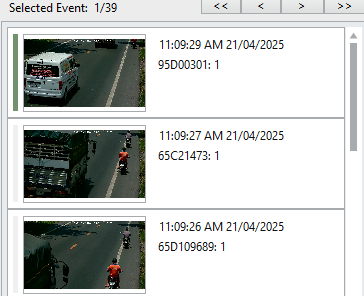
- You can zoom in/out of an event image by using
Ctrl+Scroll Up/Down
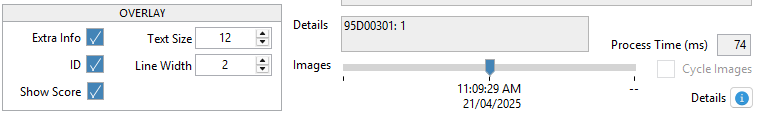
- Use the
Overlayinfo to display more information on the event image (if any) - For event with multiple images, use the image slider to navigate between each image
- Use the
Detailicon to show more counting info of the event
Filter & Search
- Filter events by Task, Camera to narrow down results.

- Use the search bar to find specific events based on keywords, timestamps.

Right-click features
Right-click on the event list, and you’ll be able to export and import event-related files for analysis, backup, or labeling purposes.
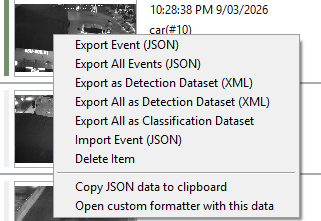
Export Event JSON: Export the event’s image and its corresponding JSON data fileExport Detection Dataset (XML): Export event’s image along with its .xml label file for object detection model trainingExport Classification Dataset: Export event images and arrange them as classification folders for model trainingImport Event JSON: Load events (image and JSON file) and display them in ANSVIS Event Log.Delete Event: Delete the selected event from the event listCopy JSON data to clipboard: Copy event JSON dataOpen custom formatter with this data: Open a dialog where you can customize and preview real event data using dymanic variables. This is useful if you use HTTP Custom Style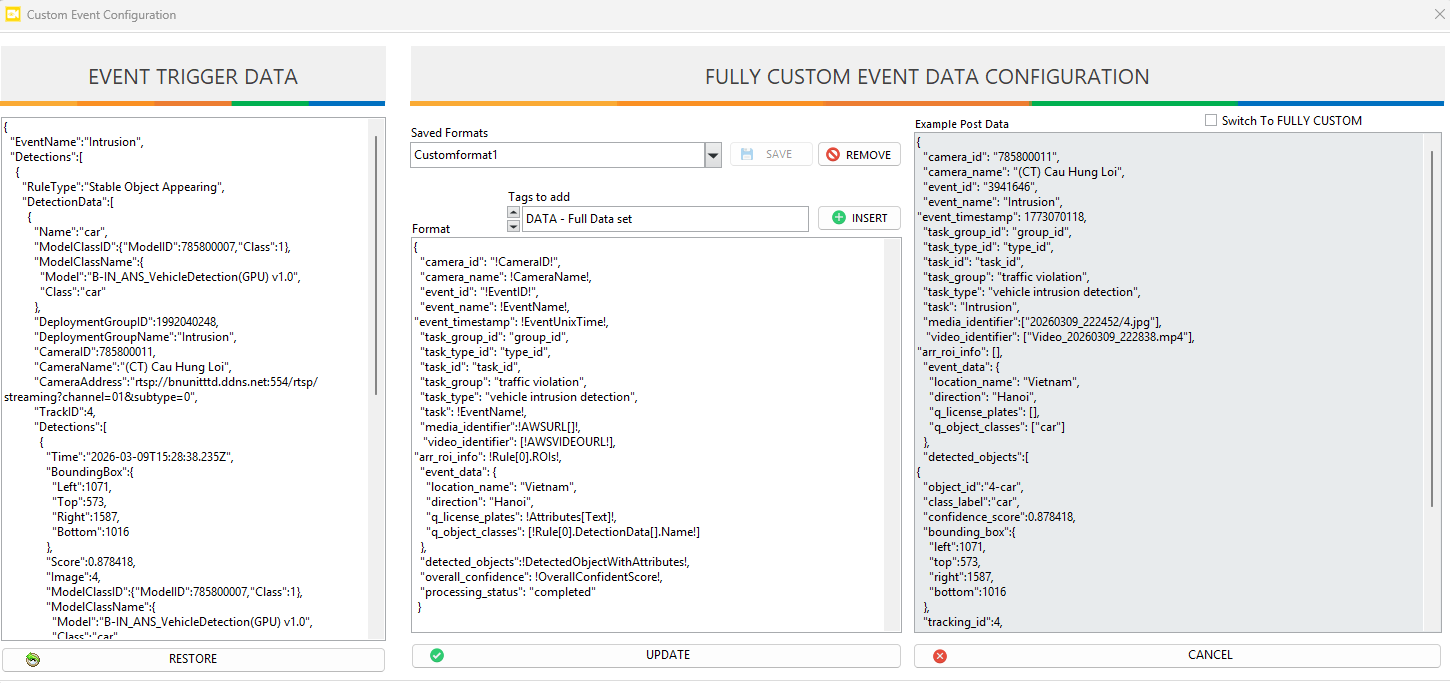
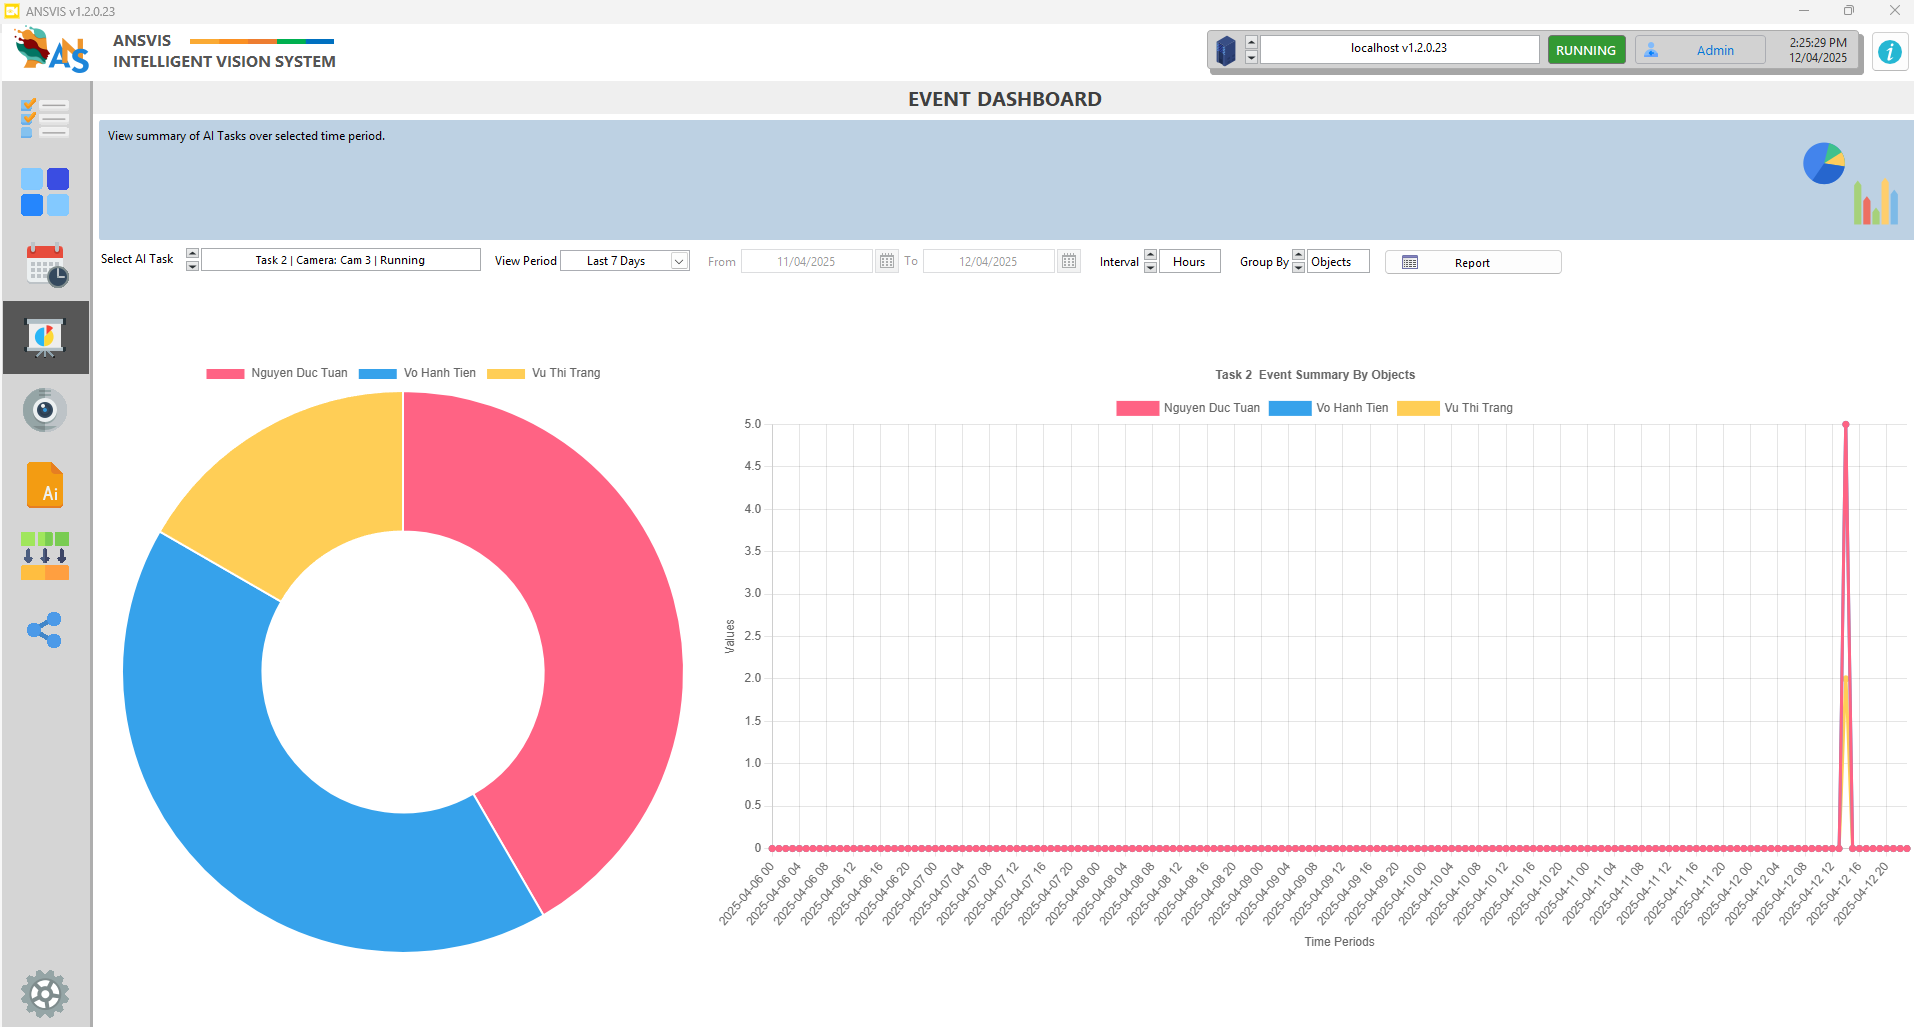
Event Summary
The Event Summary paeg provides a visual summary of event detections over a selected time period. This helps users quickly assess patterns, frequency, and distribution of events across different tasks and objects.